Client Updates
Managing client updates in the SEP product group
Client Updates
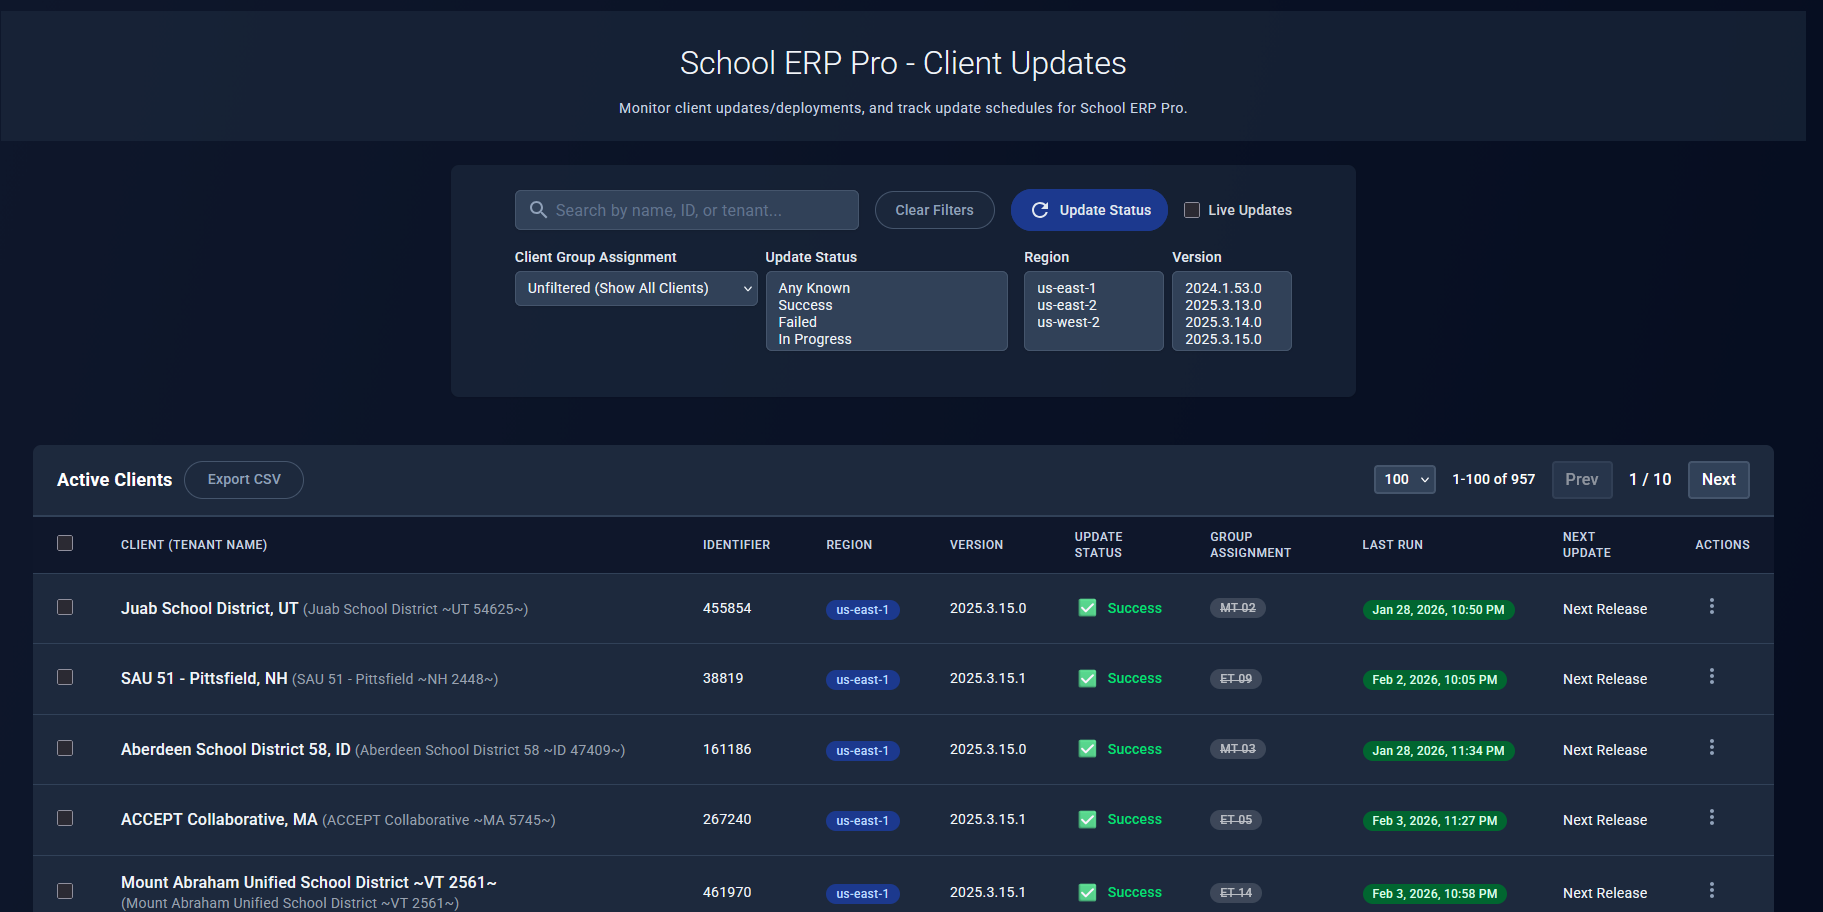
The Client Updates feature provides comprehensive management of software updates for clients in the School ERP Pro (SEP) product group. This page allows you to view, filter, schedule, and monitor client update operations across multiple AWS regions.
Overview
The Client Updates page displays real-time information about all active School ERP Pro clients, including:
- Current software versions
- Update status (Success, Failed, In Progress, Pending)
- Schedule group assignments
- Next scheduled update times
- Deployment history and logs
Accessing Client Updates
Navigate to Product → SEP → Client Manager in the main navigation menu. The Client Updates view is the default landing page for the SEP Client Manager.
Page Layout
Header Controls
The top section provides filtering, search, and refresh capabilities:
Search Bar
- Search by client name, client ID, or tenant name
- Real-time filtering as you type
- Searches across all visible fields
Control Buttons
- Clear Filters: Reset all filters to show all clients
- Update Status: Refresh deployment status data (see Refreshing Status below)
- Live Updates: Enable/disable automatic polling for status changes
Filters
The filter panel provides multiple ways to narrow down the client list:
Client Group Assignment
- Unfiltered: Show all clients regardless of group assignment
- Any: Show only clients assigned to at least one schedule group
- Active: Show clients in active (enabled) schedule groups
- Inactive Only: Show clients only in inactive schedule groups
- None: Show clients without any schedule group assignment
- Specific Groups: Filter by individual schedule group name
Update Status (multi-select)
- Any Known: Any client with a known update status
- Success: Updates completed successfully
- Failed: Updates that encountered errors
- In Progress: Currently updating
- Pending: Scheduled but not yet started
Region (multi-select)
- Filter by AWS region: us-east-1, us-east-2, us-west-2
- Select multiple regions to view clients across regions
Version (multi-select)
- Filter by installed software version
- Dynamically populated from client inventory
Data Table
The main table displays client information with the following columns:
Client (Tenant Name)
- Primary identifier for the client
- Tenant name shown in parentheses (gray text)
- Wraps on smaller screens
Identifier
- Unique client ID
- Hidden on mobile devices
Region
- AWS region badge (clickable)
- Color-coded by region:
- Blue: us-east-1
- Green: us-east-2
- Purple: us-west-2
- Click to open Machine Info modal
Version
- Currently installed software version
- Updated automatically when successful deployment completes
Update Status
- Visual indicator with icon and text:
- ✅ Success (green): Update completed successfully
- ❌ Failed (red): Update encountered an error
- 🔄 Updating (orange): Update in progress
- 🕒 Pending (orange): Scheduled update waiting to start
- 🕒 Pending (Scheduled) (orange): One-time scheduled update within execution window
- Clickable when deployment logs are available
- Failed/Updating status shows expanded log message below
Group Assignment
- Badge(s) showing schedule group membership
- Color matches region badge
- Active groups: solid color
- Inactive groups: gray with strikethrough
- Click badge to open Schedule Group Detail modal
Last Run
- Date/time of most recent deployment attempt
- Color-coded badge based on status:
- Green: Success
- Red: Failed
- Yellow: Updating
- Gray: Pending/Unknown
- Click to view deployment logs
- Shows “Never” if no deployment history
Next Update
- Next scheduled update date/time
- Shows “Pending” if date is in the past and group is assigned
- Shows “Next Release” if last run is after scheduled time
- Shows “Not Scheduled” if no schedule exists
Actions
- Three-dot menu with available actions:
- Schedule Update: Create a one-time update schedule
Features
Multi-Select Actions
Select multiple clients using the checkboxes in the leftmost column. When clients are selected:
- A blue action bar appears at the top showing selection count
- Schedule Update button becomes available
- Clear Selection button to deselect all
Scheduling Updates for Multiple Clients:
- Select clients using checkboxes
- Click Schedule Update in the action bar
- Choose version from available release channels
- Set schedule time (immediate or future date/time)
- Confirm and submit
The system creates individual schedule entries for each selected client.
Refreshing Status
The Update Status button provides three refresh scopes:
Actively Updating Clients
- Refreshes only clients with “Updating” or “Pending” status
- Fastest option for monitoring active deployments
- Recommended during active update windows
Current Page/Filtered Clients
- Refreshes only the clients currently visible (after filters applied)
- Good for checking a specific subset
- Respects current pagination
All Clients (intensive)
- Refreshes every client in the inventory
- Most comprehensive but slowest
- Use sparingly to avoid API rate limits
Status refresh bypasses the cache and queries deployment status directly from CloudWatch Logs.
Live Updates
Enable the Live Updates checkbox to automatically refresh deployment status:
- Polls every 30 seconds
- Refreshes only the current visible page
- Updates table in-place without full page reload
- Preference saved to session storage
- Automatically stops when navigating away
When to use:
- Monitoring active deployment windows
- Watching for status changes in real-time
- Tracking update progress across multiple clients
Performance Note: Live updates only refresh visible page items (100 clients max) to minimize API load.
Viewing Machine Info
Click the Region badge in any row to open the Machine Info modal:
Displayed Information:
- Instance ID
- Instance name
- AWS region
- Environment (prod, dev, staging)
- Instance type (t3.medium, etc.)
- Private IP address
- VPC ID
- Availability zone
This modal provides the complete infrastructure context for a client.
Viewing Schedule Group Details
Click a Group Assignment badge to open the Schedule Group Detail modal:
Displayed Information:
- Group name and description
- Active/inactive status
- Cron schedule expression
- Next scheduled run time
- Target version channel
- List of all clients in the group
- Update strategy settings
Use this to understand which clients are grouped together and when they’ll be updated.
Viewing Deployment Logs
Click on Update Status or Last Run badges when logs are available:
Deployment Logs Modal:
- Full CloudWatch Logs output
- Step-by-step deployment progress
- Error messages and stack traces (for failures)
- Deployment metadata (version, timestamp, duration)
- Filterable and searchable
Log Availability:
- Logs are available when
lastRunTimeexists - Logs show the most recent deployment attempt
- Older logs may be available via CloudWatch console
Scheduling Individual Updates
Use the Actions menu (three dots) to schedule updates for a single client:
- Click the three-dot menu in the Actions column
- Select Schedule Update
- Choose version from available channels
- Set schedule time:
- Immediate: Executes on next Lambda run (~5 min)
- Future: Specify date and time
- Review and confirm
The schedule is created and will be executed by the automated update Lambda.
Understanding Status Values
Success ✅
- Last deployment completed without errors
- Client is running the target version
- Safe to schedule next update
Failed ❌
- Last deployment encountered an error
- Click status to view error logs
- May require manual intervention
- Retries may be automatic depending on failure type
Updating 🔄
- Deployment currently in progress
- Lambda is actively executing update steps
- Live status message shows current step
- Typically takes 5-15 minutes
Pending 🕒
- Two possible meanings:
- Pending: Scheduled time is in the past but Lambda hasn’t executed yet
- Pending (Scheduled): One-time schedule created, Lambda will pick up soon
Unknown
- No deployment history available
- New client or status not yet queried
- Click Update Status to fetch latest information
Status Indicator Colors
| Color | Meaning | Use Cases |
|---|---|---|
| Green | Success | Normal operation, update completed |
| Red | Failed | Error occurred, needs attention |
| Orange/Yellow | Updating or Pending | In progress or waiting to start |
| Gray | Unknown/Not Scheduled | No data or no schedule |
Filtering Tips
Finding Problematic Clients
- Set Update Status to Failed
- Review error messages in Update Status column
- Click status to view full deployment logs
- Address issues and retry update
Viewing Unscheduled Clients
- Set Client Group Assignment to None
- See all clients without schedule group
- Assign to group or create one-time schedule
Checking Schedule Group Health
- Set Client Group Assignment to a specific group
- Review update status for all group members
- Ensure consistent versions across group
- Identify outliers or failures
Regional Analysis
- Select one or more regions in Region filter
- Compare version distribution across regions
- Identify regional update delays
- Plan region-specific update strategies
Performance Considerations
Table Pagination
- Default page size: 100 clients
- Pages load quickly even with thousands of clients
- Filters apply across all pages, not just visible rows
Status Refresh Impact
- Active Clients: Low impact, recommended
- Current Page: Medium impact, safe for frequent use
- All Clients: High impact, use sparingly
Live Updates
- Polls current page only (max 100 clients)
- Automatically stops on navigation
- Session-based, doesn’t persist across browser restarts
Common Workflows
Monitoring an Active Deployment
- Enable Live Updates checkbox
- Set Update Status filter to Updating, Pending
- Watch status indicators update every 30 seconds
- Click Update Status to see detailed progress
- Review Last Run when deployment completes
Scheduling a Group Update
- Filter by Client Group Assignment → select target group
- Click Select All checkbox (if needed)
- Click Schedule Update in action bar
- Choose version and time
- Confirm schedule
- Monitor via Live Updates
Investigating Failed Updates
- Set Update Status filter to Failed
- Review each failed client’s status message
- Click status badge to open Deployment Logs
- Identify error pattern (network, permissions, version issue)
- Take corrective action
- Retry update via Schedule Update action
Preparing for Release
- Clear all filters to see full inventory
- Review current version distribution
- Identify clients on old versions
- Create schedule groups or one-time schedules
- Monitor deployment progress
- Verify success across regions
Related Documentation
- Understanding Statuses - Detailed status definitions
- Scheduling Updates - Creating and managing schedules
- Viewing Deployment Logs - Interpreting log output
- Live Updates - Real-time status monitoring
- Filtering and Search - Advanced filter techniques
How It Works (Behind the Scenes)
Where Data Comes From
The Client Updates page pulls information from multiple sources to give you a complete view:
- Client list: All active clients and their current configurations
- Schedule groups: Update group assignments and schedules
- Deployment status: Real-time status from recent deployment attempts
- Available versions: Software versions you can deploy
Automatic Updates
- Status refresh: Happens when you load the page or click “Update Status”
- Live Updates: Checks for changes every 30 seconds when enabled
- Scheduled deployments: System checks every 5 minutes for deployments that are ready to run
Why Some Data Is Cached
To keep the page fast, some information is temporarily cached:
- Manual refresh always gets fresh data
- Live Updates always get fresh data
- Initial page load may use recently cached data for speed
This means the page loads quickly, but you can always force a refresh to get the absolute latest information.
Related Documentation
- Understanding Statuses - Detailed status definitions
- Scheduling Updates - Creating and managing schedules
- Viewing Deployment Logs - Troubleshooting deployments
- Live Updates - Real-time status monitoring
- Filtering and Search - Advanced filter techniques
See Also
Related SEP Features
- Overview - Client Manager introduction
- Client Operations - Working with individual clients
- Update Groups - Automated update scheduling
ERP Pro Equivalent
For ERP Pro clients, operational features are available through:
- ERP Pro Client Manager
- Form Exchange - Form deployment
- File Locks (v9) - Lock management
Note: ERP Pro focuses on operational tools, while SEP provides full update management capabilities.